Figure 1. NaCl concentration profiles measured during drying
of a fired-clay brick sample
of 45 mm length after 0, 1, 3, 6, 9, 12, and 15 days.
Figure 1. NaCl concentration profiles measured during drying
of a fired-clay brick sample
of 45 mm length after 0, 1, 3, 6, 9, 12, and 15 days.
During the initial drying, Na ions are advected to the surface
(position 0 mm) and the NaCl concentration slowly increases to 6
M, which is the saturation value for a NaCl solution. At this
point additional advection will result in crystallization at the
top of the sample, which is observed as a white efflorescence.
From this point on the NaCl concentration profile in the sample
starts to level off until the total sample is at 6 M. During a
drying experiment there will be a competition between advection,
which transports ions to the top of the sample and thereby causes
accumulation, and diffusion, which levels off any accumulation.
The transport of the ions can be desribed by:
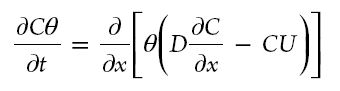
This equation shows the competition between advection and
diffusion. On the right-hand side of the equation the first term
represents the diffusion process, whereas the other term
represents the advection process. The competition between these
two processes is given by the Peclet number:
where L (m) is the length of the sample and D the diffusion
coefficient of Na in the porous material (~1.3 × 10⁻⁹ m2
s−1). Using measured moisture profiles the fluid
velocity U can be calculated. For Pe<<1 diffusion dominates
and the ion-profiles will be uniform, whereas for Pe>>1
advection dominates and ions will be accumulated at the drying
surface. Initially the drying rate gives rise to Pe~ 3,
corresponding to the accumulation of the 6 M peak at the surface,
whereas after two days Pe~ 0.7, corresponding to the
leveling off of the NaCl profile
In order to do the analyses of the advection−diffusion processes
in an experiment, the data can also be represented in a so-called
Efflorescence Pathway Diagram (EPD).
Figure 2. Efflorescence pathway diagram: CavgSavg,
which represents the total amount of NaCl present in the
solution, as a function of the average saturation Savg.
EPD for the experiment plotted in Fig. 1. Indicated are the
points corresponding to the profiles plotted in Fig. 1
In an EPD the total amount of NaCl present in the solution CavgSavg ,that is, the amount directly measured by NMR, is plotted against the average saturation Savg. In this diagram two limiting situations can be distinguished:
Line A, B : In the case of very slow drying (i.e., Pe<<1), the ion profiles stay homogeneous and for some time no crystallization will occur. The average NaCl concentration slowly increases (line A) until the complete sample has reached 6 M. From this point on any additional drying will result in crystallization (line B).Line C : In the case of very fast drying of the samples (i.e., Pe>>1). Now ions are directly advected with the moisture to the top of the sample and a 6 M peak will build up with a width so small that the average concentration is not significantly affected. If the rate of crystallization is high enough, that is, if there are enough nucleation sites at the top, the average NaCl concentration in the
solution in the sample itself will remain constant at nearly the initial concentrationFrom any point within the region bounded by the lines A-C only moisture removal will result in an increase of the
NaCl concentration. A decrease of CavgSavg can only take place by crystallization. This requires that ions
are transported to a region with a local concentration of 6 M peak, that is, the drying surface in our experiments. Because the transport is driven by evaporation, crystallization always involves a (small) change of Savg.
For the experiment shown in Figs. 1 the corresponding pathway is
plotted in Fig. 2. This pathway indicates that during the
first 9-12 days a peak in the NaCl concentration is present and
salt will crystallize at the top; that is, there is salt
efflorescence. Thereafter the concentration in the sample is 6 M.
More measured pathways can be found in the Applied
Physics Letters 81, 2893-2895 (2002)
EPD-diagram for droplet
In order to do the analyses of the advection−diffusion processes
in a droplet, the data are plotted in a way that is somewhat
similar to a efflorescence pathway diagram (EPD). In the case of a
droplet drying, the total amount of dissolved salt content in the
droplet is plotted as a function of the normalized volume of the
droplet (V/Vinitial). As an example the EPD is given
for the drying of a droplet of NaCl with and without
salt-inhibitor in fig 3.
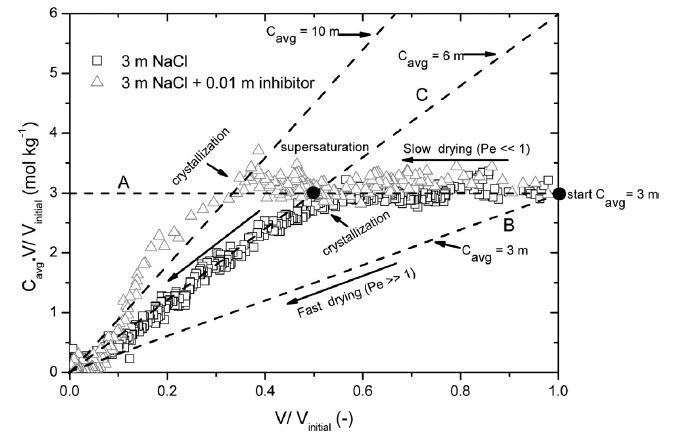
Fig 3. Advection−diffusion analysis diagram for the
droplet drying experiment: The total amount of dissolved sodium
in the droplet is
plotted as a function of the volume of the droplet (V).
Both the axes are normalized with respect to the initial volume
of the droplet
(Vinitial). The division of both
the axes gives the average concentration (Cavg) of Na
in NaCl solution droplet shown by solid lines in the
figure. The results for 3 m NaCl salt solution droplet with
(△) and without inhibitor (□) are shown.
As can be seen for the salt solution droplet, initially the Pe
< 1 path is followed indicating diffusion dominance and the
concentration increased until nearly the saturation concentration
was reached, after which it stayed constant at approximately the
saturation concentration 6.1 m.The results from the drying of a
salt solution droplet with inhibitor are also plotted in Figure 3;
as can be seen in this case the sodium concentration also remains
homogeneous until crystallization and the droplet supersaturates,
reaching a maximum concentration on the order of 10 m before
crystallization.
Conclusion
An EPD diagrams reflect the competition between advection to the
surface and redistribution by diffusion, but also takes into
account the crystallization. An EPD of an experiment can give
information on the Pe-number without doing any simulations.
L. Pel, H. Huinink, K. Kopinga, Ion transport and
crystallization in inorganic building materials as studied by
nuclear magnetic resonance, Applied Physics Letters 81,
2893-2895 (2002)
H.P. Huinink, L. Pel and M.A.J. Michels, How ions distribute in
a drying porous medium-simple model, Phys. Fluids 14,
1389 (2002)
L. Pel, H. Huinink, K. Kopinga, R.P.J. van Hees and O.C.G.
Adan, Efflorescence pathway diagram: understanding salt
weathering, Construction and
Building Materials Special issue: Masonry Research in The
Netherlands - Ed.C.J.W.P Groot 18, 309-313 (2004).
Sonia Gupta, Kristina Terheiden, Leo Pel, and Alison Sawdy,
Influence of ferrocyanide inhibitors on the transport and
crystallization processes of sodium chloride in porous building
materials, Crystal Growth & Design, 2012 (DOI:
10.1021/cg3002288)